| 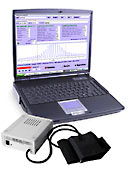  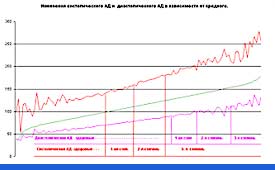
Oscillometric analyzer of the parameters of heart emission and arterial pressure HPTV®
is the diagnostic firmware complex, intended for the output, mappings, analysis and storage of information about the state of cardiovascular system on the basis of the method of volumetric
compression oscillometry (VCO).
Analyzer ensures:
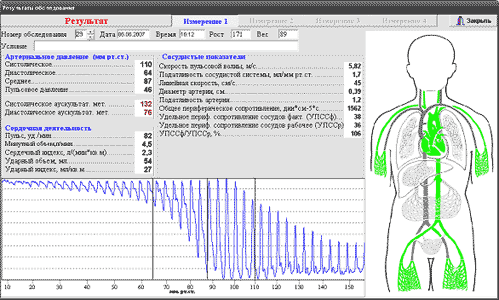
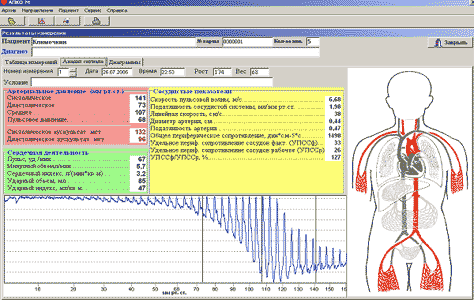
· recognition and the measurement of the primary amplitude-time characteristics of oscillometric curve, and also the calculation of the second indices
· control of work in the semiautomatic and dialogue regime
· the visualization of the obtained oscillograms and calculated indices in the tabular and graphic forms
· the possibility of updating into the results of measurement and processing
· storage and the reproduction of the information about the patients, the conditions for inspection and the results of the measurements
· statistical processing of the obtained massifs of the data
· flexible control of the content and the form of the total protocols
· the export of the obtained given in the form electronic tables (size Excel)
Volumetric compression oscillography by HPTV®
One hundred years ago on Nov. 8, 1905, the 31-year-old surgeon Nokolai Sergeevich Korotkoff, working in the clinic of Professor Sergei P. Fedorov, made a presentation at
a scientific seminar of the Imperial Military Medical Academy in St. Petersburg, Russia. He described to an astonished audience a new method of measuring systolic and diastolic blood pressure.

Figure 1. Nikolai Sergeevich Korotkoff. (Photograph courtesy of The Russian Military Medical Academy, Saint Petersburg, Russia.)
Korotkoff's discovery originated from the observation that in wounded soldiers certain sounds could be auscultated during gradual decompression of the arteries. As a surgeon, Korotkoff was
interested in predicting the outcome in a traumatized limb after ligation of arteries, which obviously depended on the collateral circulation.
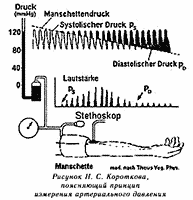
Figure 2. Schema for measurement of Korotkoff`s sounds
He therefore systematically auscultated the arteries in his patients and thereby coincidentally discovered what is now known as the Korotkoff sounds. In his subsequent experiments
this apparatus by simultaneously palpating the radial artery, thereby not being able to provide information about diastolic pressure.

Figure 3. Riva-Rocci sphygmomanometer used by Korotkoff in his measurements (from Korotkoff's dissertation2 ).
The length of the cuff was approximately 1 2 arshin (35.56 cm) and the width was at least 21 2 to 3 inches (6.35 to 7.62 cm).
Today, exactly one full century later, thousands of physicians, nurses, medical assistants and patients all over the globe continue to listen by stethoscope to the Korotkoff sounds in the br
useful clinical tool to gather this information.
Even the myriad electronic and digital instruments that have been developed over the past decade to monitor blood pressure work simply by listening to the Korotkoff sounds.
Also known in the art presently is a tacho-oscillographic method for measuring arterial pressure developed by N. N. Savitski as disclosed in his monography entitled "Biophysical fundamentals
of circulation and clinical methods for study of hemodynamics", 1974, Leningrad, Meditsina Publishers, pp. 141-150 (in Russian). The method is also based on measurement changes in the volume
of the patient's limb vessel being examined, which changes are liable to occur under the effect of throbbing blood stream flow along the major blood vessels. The method is capable of measuring
the diastolic, mean dynamic, lateral systolic, and end systolic arterial pressure in the major blood vessel of the limb to which a measuring vessel-constricting cuff is applied. The arterial pressure
parameters are determined while the pressure in the cuff is being raised, since it is considered that in this case linearity of pressure variation can be ensured more readily.
The measuring system for registering tacho-oscillograms comprises pneumatic and electronic units. Used as a converter is a differential air pressure gauge, and the curve is recorded on
a photographic paper.
Theoretical bases of volumetric compression oscillography.
The oscillometric method, proposed in 1878 Mareyem, at present is used for measuring the arterial pressure in man on the basis of different systematic and apparatus solutions. As a result of development
and improvement of the oscillometric method of measuring the arterial pressure N.N. Savitski, and then the association of Russian scientists under the management of Degt`arev V.A., obtained the new
method of registering the volumetric arterial oscillograms, which reflects the true processes, proceeding in the arterial vessel under the superimposed to the extremity sleeve, with the subsequent estimation
it is more than 20 indices of hemodynamics. In the basis of method VCO is assumed the method of determining the dynamic change in the volume main arterial of the vessel being investigated, which is
achieved by an original measuring system. This makes it possible with the high degree of authenticity to determine by calculation a whole series of the parameters of heart activity and indices of the state
of vascular channel. The method of determining the indices AD via volumetric compression oscillometry of high resolution includes the registration of pulse curved blood vessels in the process of changing
the pressure in the measuring sleeve, with the subsequent electrical and graphic transformation of the fluctuations of the volume of air in it. The improvement of method made it possible to record and to write
the unchanged (true) curve of the fluctuations of AD in the vessel under the sleeve taking into account all components of its frequencies (from 0 Hz to 50 Hz) so that the curve proved to be practically i
dentical record with straight manometry, which determines large value and significance of method (Fig.4).

Figure 4. Curves of the registration of the arterial pressure: a) by the method of straight manometry and b) by the method of volumetric compression oscillometry of high resolution
Fig. 5 schematically depicts the formation of the oscillometric curve of arterial vessel with the pressure buildup in the sleeve with the subsequent change in the volume of the measured vessel.
In consequence of which the amplitude of the pulse waves of the curves of pressure in the oscillometric curve is proportional to the cross-sectional area of vessel. As can be seen from the represented
figure, the initial (diastolic) part of the volumetric compression oscillogram in proportion to pressure buildup in the sleeve displaces downward. Initially in the process of pressure buildup in the sleeve
they record the graph of linear magnification in the pressure and venous- arterial oscillometric curve, then - curve of arterial pulse. At the point of the beginning of the withdrawal of curve downward
the pressure in the constricting sleeve is equalized with the diastolic arterial pressure (DAD) in the vessel and in the course of time exceeds it to ever larger value, decreasing with each heart contraction
the inside diameter of artery into the diastole.
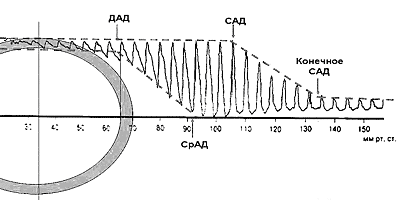
Figure 5. The diagrammatic representation of standard volumetric compression oscillogram. ??? - diastolic AD (DAD), ???? - average AD (AAD), ??? - systolic (SAD) AD.
|